

Predictive Maintenance for PLC and SCADA Systems: An Engineer's Field Guide
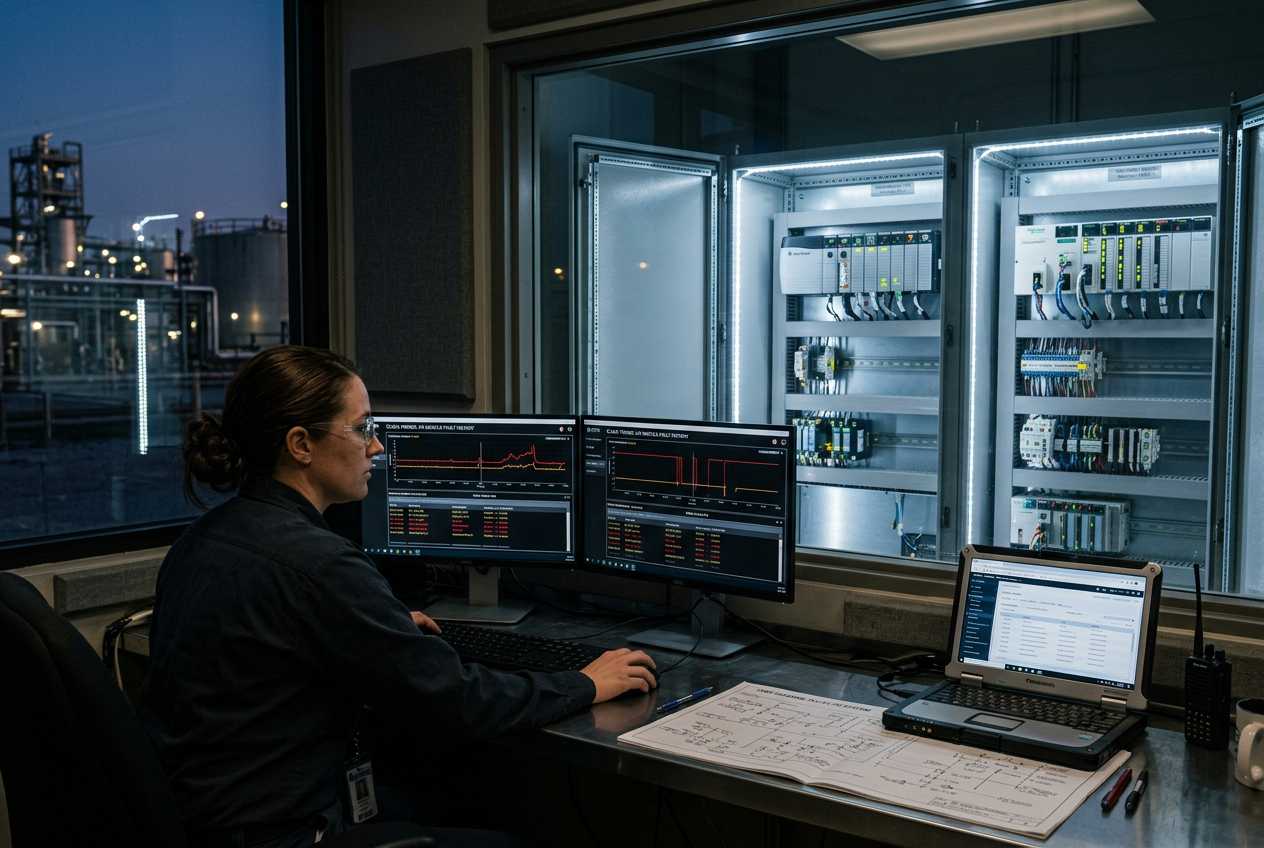
In modern industrial facilities, the automation layer rarely fails catastrophically without warning. An I/O module drops offline intermittently once a week, or a remote communication drop times out twice per shift. Production continues uninterrupted, but critical warning signals accumulate quietly in diagnostic buffers. Rather than deploying costly supplementary vibration or temperature sensor networks, effective predictive maintenance starts by actively listening to the diagnostic data your controllers and communication bridges already publish.
Why should predictive maintenance start inside your existing PLC controllers?
As industry experts at InstrumentationTools recently highlighted, PLC and SCADA diagnostic registers contain early failure signatures long before mechanical failure occurs. Field experience demonstrates that automation equipment degrades quietly: silent packet drops, retries, and buffer errors build up inside controller memory. Tapping into these existing internal metrics provides immediate condition monitoring without investing in redundant secondary instrumentation.
How do you monitor EtherNet/IP health on Allen-Bradley ControlLogix?
Allen-Bradley ControlLogix architectures, powered by high-performance controllers like the Allen Bradley 1756-L85EP ControlLogix 5580 Process Controller Module, offer deep diagnostic visibility through GSV (Get System Value) instructions and native web interfaces on bridge modules like the Allen Bradley 1756-EN2T EtherNet/IP Communication Bridge Module.
-
Read status words periodically: Execute periodic GSV instructions to query
Module:StatusandModule:FaultInfotags at one-minute intervals. - Track CIP connection counters: Use the embedded EN2T web diagnostics to log CIP connection timeouts, focusing on specific Requested Packet Interval (RPI) groups.
- Flag recurring link drops: Set logic flags when remote drops, such as Flex I/O or Point I/O adapters, reconnect more than three times per 24-hour cycle.
- Stream quality tags to SCADA: Push calculated device quality status to your SCADA historian alongside operational process tags.
This approach requires no auxiliary hardware and identifies deteriorating unmanaged switches, damaged patch cords, or marginal fiber transceivers weeks before causing an unexpected line outage.
How do you trend Modbus TCP communication errors on Schneider M340?
Schneider Electric Modicon architectures, including the Schneider Modicon M340 BMXP342000 Processor Module paired with dedicated interfaces like the Schneider BMXNOC0401 M340 Ethernet Communication Module, log detailed communication health statistics per channel within Unity Pro / EcoStruxure Control Expert.
-
Poll system words: Poll internal
%SWcommunication status registers and channel error counters at five-minute intervals into your historian. - Analyze rate of change: Calculate the error rate over time rather than tracking cumulative counts, as rate spikes reveal acute component degradation.
- Track Modbus exception codes: Pay close attention to repeated Exception 03 responses, which frequently indicate register mismatches following third-party device firmware updates.
- Correlate errors with environmental conditions: Plot communication error spikes against ambient cabinet temperature and machine vibration to quickly locate loose wiring terminals.
Filtering is key: an isolated exception daily is normal communication noise, whereas fifty retries per hour indicates a failing field transceiver or network saturation.
How can you feed predictive alerts into a CMMS without causing alarm fatigue?
If every transient network glitch generates a maintenance ticket, maintenance technicians quickly become desensitized. A disciplined qualification strategy preserves technician trust:
- Require condition repetition: Set CMMS trigger thresholds to require persistent issues, such as three dropped sessions on a node within 24 hours.
- Enrich ticket context: Automatically append the specific asset tag, exact diagnostic error code, and plain-language symptoms to each work order.
- Separate operation from maintenance: Keep control room operator alarm acknowledgments distinct from maintenance work order sign-offs.
- Audit rules routinely: Review automated trigger performance monthly and retire thresholds that produce non-actionable notifications.
- Treat network hardware as assets: Explicitly include managed switches, fiber media converters, and SCADA server pairs in the CMMS asset register.
What is the expected return on investment for controller-level predictive maintenance?
Transitioning from reactive troubleshooting to planned maintenance intervals eliminates high-cost emergency downtime. Spare parts inventory becomes accurately data-driven, and new commissioning diagnostic baselines integrate seamlessly into historical maintenance records.
To implement this successfully, begin by monitoring ten critical network nodes or I/O drops across your facility, establish baseline trends, and expand the framework across your remaining controllers.
Author: Chen Weiming is an industrial automation engineer with over 10 years of experience in PLC, DCS, and control systems.


